Getting Started
Installation
Run the line shown below to install nyaplotjs to your local project.
npm install nyaplot
Try nyaplotjs using Simple API
<html>
  <head>
    <script src='http://d3js.org/d3.v3.min.js'></script>
    <script src='https://cdn.rawgit.com/domitry/Nyaplotjs/a1b10b68f08cfbd5afc4e145103ac46297951d45/release/nyaplot.min.js'></script>
    <script>
    window.onload = function(){
       // code for plotting from here
    };
    </script>
  </head>
  <body>
    <div id="vis"></div>
  </body>
</html>
Prepare data to visualize.
var xarr=[], yarr1=[], yarr2=[], N=1000, curry1=0.0, curry2=0.0;
for(var i=0;i < N;i++){
  xarr.push(i);
  yarr1.push(curry1+=(Math.random()-0.5));
  yarr2.push(curry2+=(Math.random()-0.5));
}
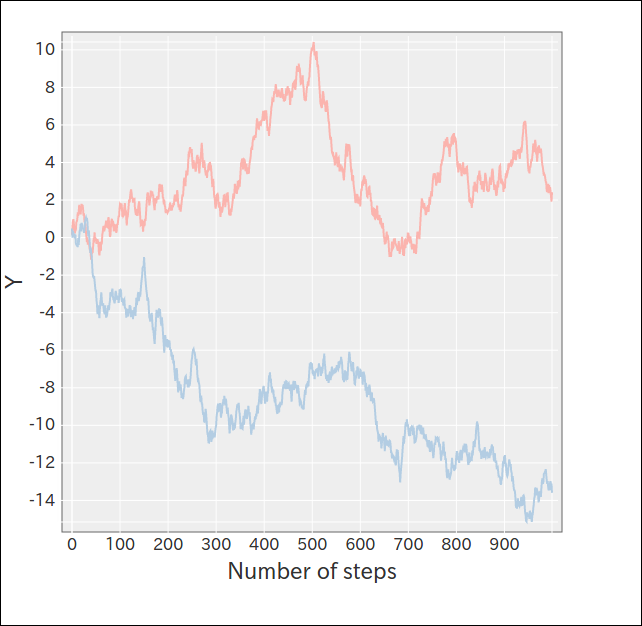
Specify div element which svg will be appended to (“vis” in this example) and begin rendering.
var plot = new Nyaplot.Plot({xlabel: "Number of steps"});
var line1 = new Nyaplot.Line(xarr, yarr1, {color: "#fbb4ae"});
var line2 = new Nyaplot.Line(xarr, yarr2, {color: "#b3cde3"});

plot.add([line1, line2]);
plot.show("vis");